Importance of Social Media Insights
You are probably an expert at the key areas of your business but maybe there are some things that you put to one side as you have no interest or no time to tackle them… This is where a Red Desk Virtual comes in. You can hire a us to handle your social media and provide you easy to read reports on how a social media campaign is performing.
Quarterly Reports
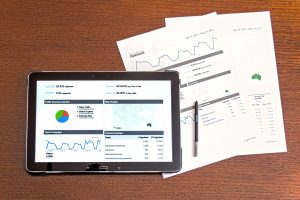
We provide our clients with quarterly social media reports on how well their chosen social media platforms are performing, plus statistics from Google Analytics (website) and Google Business.
These reports are useful to both our clients and us as social media managers as we can see how successful campaigns are. You can often see where budget has been increased or decreased as the number of followers or page views/profile visits will increase/decrease accordingly.
All Singing and Dancing Reporting
We’ve recently invested some time into improving our reports so that clients can also see the top performing posts, further insights into website and social media user behaviour and information on competitors. Our talented VA Emma has put these reports together in an easy-to-read format, and after analysing the data, we are able to adjust our social media campaign for each client accordingly.
Top Performing Posts
We like to see where our successes are, and a good start is to look at your top performing posts.
You need be clear on your social media goal, are you aiming to promote your brand by increasing engagement & reach or are you aiming to drive traffic to your website. Your goal will determine what data you look at & how it will inform your future posting.
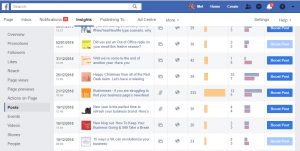 In Facebook, top performing posts can be found if you click on Insights at the top of your business page, and then select posts from the left hand side bar. In all posts published, you can easily see which posts have done the best.
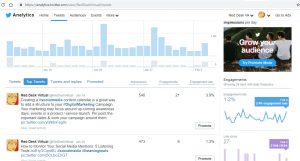
For Twitter, head to https://analytics.twitter.com/about and then log in. On the top menu bar select tweets and then top tweets. You have access to the last 28 days’ worth of data so make sure you log in at least once a month to stay on top. For more information about Twitter Analytics, read our article Getting the most out of Twitter.
For Instagram, firstly you will need an Instagram business profile. Select the bar graph at the top right hand side, in the analytics section, 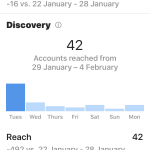 scroll to posts, and then click on see more. Unfortunately you will need to click on each post to see the engagement rates. For information about how to access other social media metrics, take a look at this useful article by CoSchedule.
However if you don’t want to gather this data manually, you will need to use a social media management tool. There are many out there and this StartUps article reviews a number of them, suitable for all budgets.
How to analyse the data
Analysis of posts can be important because it can show you where the successes and failures are. It’s not just about the topic of the post but also the length, the tone, the language, colours used in images and much more. By asking questions about your posts, you will start to identify what impacts on your post’s performance.
 A few things to note:
- The tone and voice of the posts should reflect your brand tone and voice
- Are your posts mainly positive or negative? If you are writing for a community group, it is important to celebrate the successes of your area (new business opened) but also highlight failures too (business closed)
- Posts with open-ended questions will encourage more interaction whereas closed questions provide information or instructions
- The number of hashtags will depend on the social platform you are on
- Check when your social media audience is active and adjust your posting times to maximise the views. The more people reading or sharing your posts, the higher chance of them clicking on links back to your website.
Once you have gathered all this data together, you will need to put it into a report. Record all your data and repeat this on a weekly/monthly/quarterly basis (depending on time constraints). Remember to sit down and take time to adjust your social media posting strategy based on the data.
If you need any further help setting up social media reporting for your business, please get in touch with lindsay@reddesk.co.uk.